
Johann Jakob Balmer did not set out to revolutionize physics. In 1885, the Basel mathematics teacher noticed that four hydrogen wavelengths measured by Anders Ångström fit a surprisingly tidy numerical pattern: 656.3, 486.1, 434.0, and 410.2 nanometers. That observation became the Balmer series, and its importance far exceeded the modest setting in which it was made. Balmer was not an astronomer, not a spectroscopist。and not a professor at a research institute. He was a secondary-school teacher with a talent for numerical patterns. The measurements he used were not pristine by modern standards, yet the ratios were clean enough to expose a hidden order. The four lines he fitted were visible-light emissions from hydrogen, and his formula predicted a fifth line that was later found in stellar spectra. The series is not the whole hydrogen spectrum, only the transitions ending at the second energy level, but its visible lines made it the most accessible entry point. The episode is a useful reminder that a sharp pattern can outrun the theory that eventually explains it.
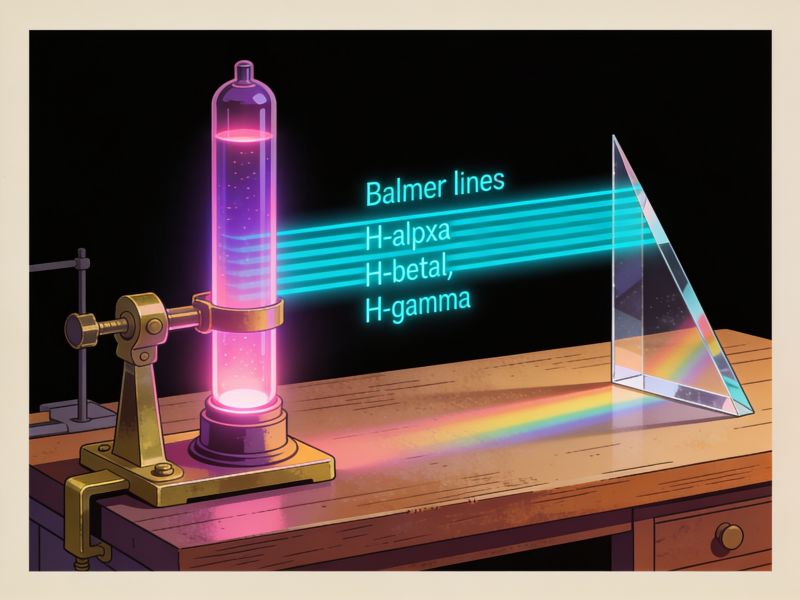
The Balmer formula has a compact form: lambda equals B times n squared divided by n squared minus four, where B is about 364.56 nanometers and n takes integer values 3, 4, 5, and so on. Each integer yields a line in the Balmer series. For n = 3。the formula gives H-alpha at 656.3 nanometers;n = 4 gives H-beta at 486.1 nanometers;n = 5 gives H-gamma at 434.0 nanometers. These are the familiar Balmer lines that give many emission nebulae their pink-red glow. The series converges toward a limit near 364.6 nanometers as n grows, a detail that makes the formula more than a list of measured values. What makes the Balmer result remarkable is its economy. A single constant and a simple integer sequence reproduce a family of spectral features with impressive accuracy. The formula does not explain why hydrogen should behave this way. It simply captures the arithmetic, and that is enough to make it useful.Niels Bohr supplied the explanation in 1913. In the Bohr model, an electron occupies discrete energy levels around a proton, and a Balmer photon is emitted when an electron drops to the second level from a higher one. The Balmer series therefore became an early proving ground for quantum theory. Bohr's prediction of the Rydberg constant from fundamental constants matched the spectroscopic data, and the Balmer formula fell into place as a special case of a broader principle. That shift matters. Before Bohr, the Balmer series was an empirical curiosity;afterward。it was evidence that atomic energies are quantized. The energy gap for H-alpha is about 1.89 electron volts, small enough to appear in the visible spectrum but large enough to be measured with nineteenth-century instruments. The lines were no longer just convenient numbers. They were fingerprints of transitions between states, and the Balmer name became attached to one of the most recognizable families in atomic physics.
Astronomers use Balmer lines constantly, though often without pausing to credit the schoolteacher. H-alpha, the strongest Balmer line in the visible spectrum, traces ionized hydrogen in star-forming regions, planetary nebulae, and supernova remnants. The Balmer decrement, the ratio of H-alpha to H-beta, helps estimate dust reddening because dust absorbs shorter wavelengths more efficiently. Balmer absorption lines appear in the spectra of hot stars and quasars, and the Balmer break is a useful feature for identifying certain galaxies. Doppler shifts of Balmer lines also feed radial-velocity measurements, including searches for exoplanets around cool stars. In practice, H-alpha is often the first feature a new spectrograph is pointed at。because it is bright, isolated, and easy to recognize. I find it striking that a nineteenth-century numerical exercise remains part of the daily vocabulary of observatories. The Balmer series is not a historical relic. It is a working tool, calibrated, tabulated, and embedded in software pipelines that process spectra by the thousand.Johann Balmer's life did not follow the arc of a celebrated physicist. He was born in 1825, studied mathematics and theology, and spent much of his career teaching. His 1885 paper was brief, and he continued working on numerical relationships in spectra. He died in 1898, before quantum mechanics gave his formula a deeper foundation. The Balmer series brought him posthumous recognition, but the formula's endurance rests on more than priority. It survives because it is testable, portable, and precise enough to anchor both classroom exercises and research-grade spectroscopy. A plaque in Basel is pleasant, but the formula in a pipeline is better evidence of influence. The Balmer lines also carry a quiet warning about scientific credit: the person who finds the pattern may not be the person who explains it, and the person who explains it may not be the person whose name the pattern bears. In the case of Balmer。
the name stuck, and the hydrogen spectrum has never stopped justifying the attention.